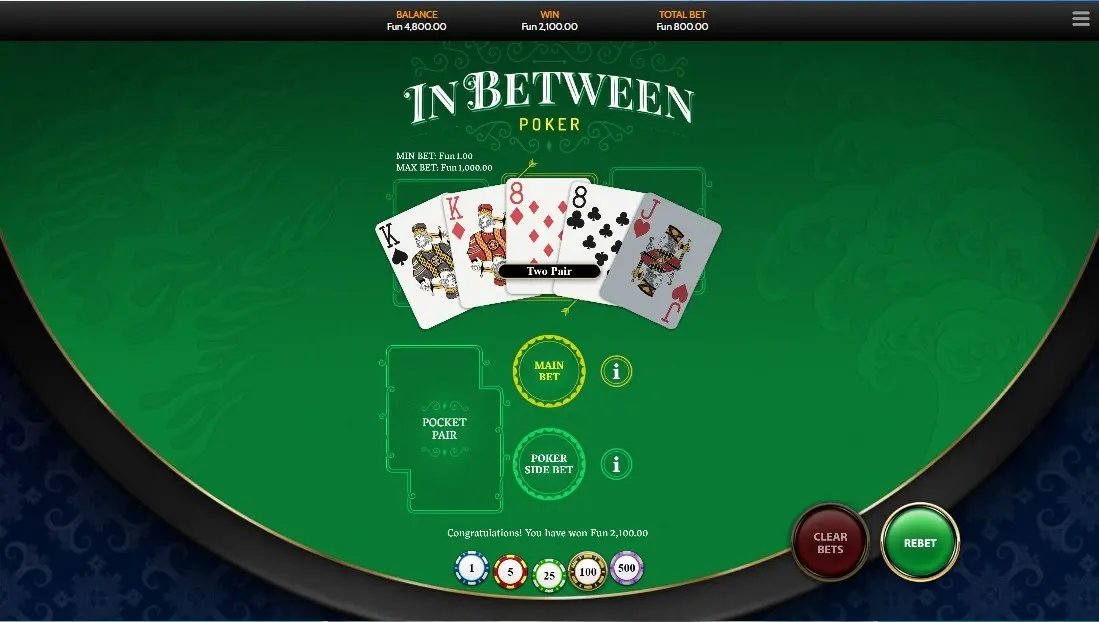
In between poker is a OneTouch card title carrying a stated return of 94.6%, which sits well below what a well-paid video poker paytable delivers. The free demo is available, so you can learn the ruleset and the pay chart without staking anything. Whether it is worth your money afterwards depends almost entirely on numbers this listing does not give you.
Is In Between Poker worth your time?
As a free demo, yes — it costs nothing but time, and it is the fastest way to read the in-game pay chart and see exactly how the game resolves a hand. As a real-money proposition, the 94.6% figure is the whole story you need to weigh. In the video poker and card category the return is not a hidden setting: it is arithmetic performed on the payout schedule, assuming you make the mathematically best decision every hand. A 94.6% game gives back 94.6% over an enormous number of hands played perfectly, which means roughly 5.4% of every unit you cycle through is the house edge.
Compare that to what the same category can offer. A 9/6 Jacks or Better paytable returns about 99.5% with optimal play. That is a five-point gap, and five points is enormous — it is the difference between a game you can play for hours on a small budget and one that eats a bankroll several times faster. Nothing about presentation, speed or interface offsets a five-point difference in return. So the honest answer: play the demo freely, and treat the real-money version as an expensive version of a category that offers much cheaper options.
| Provider | OneTouch |
|---|---|
| RTP | 94.6% |
| Theme | Cards |
| Free demo | Yes |
| Site-wide average RTP | 97.5% |
Jacks or Better, Deuces Wild or something else? What the name tells you
The title does not name a standard video poker variant. “Jacks or Better”, “Deuces Wild”, “Joker Poker”, “Double Bonus” and “Aces and Faces” all identify a known ruleset with a published, solved strategy chart. “In Between Poker” does not map onto any of those, so you cannot infer the hand ranks it pays, whether wilds are involved, or what the minimum paying hand is. This listing does not state the ruleset either.
That matters more than it would in most categories. In a slot, not knowing the mechanics costs you nothing mathematically — the reel weighting is hidden regardless. In a card game solved from a payout schedule, the ruleset and the schedule are the return. If you cannot see them, you cannot check whether the game is well-paid or badly paid, and you cannot know which decision is correct on a given hand.
So do the obvious thing: open the demo and read the pay chart on screen before anything else. Note the minimum paying hand, note what the mid-ranked hands pay, and note whether any card acts as a wild or a bonus. Those few numbers tell you more about the game than any description can. If you want a title where the variant is named up front and the strategy is publicly solved, Jacks or Better (Red Rake Gaming) is the standard reference point at 99.55%.
Return to player: 94.6%
OneTouch states 94.6%. Read that as a long-run average across a very large number of hands, not a description of a session. Over a few hundred hands the spread of outcomes is wide in both directions; the average only asserts itself over volumes no player reaches in an evening.
What this listing does not include is the paytable that produces 94.6%. In this category that omission is significant, because the payout schedule is the mechanism, not a decoration on top of one. In Jacks or Better, moving the full house from 9-for-1 to 8-for-1 and the flush from 6-for-1 to 5-for-1 drops the return from roughly 99.5% to about 97.3% — two numbers on a chart, more than two points of return. A 6/5 schedule pushes the same game below 95%. Nothing else changed: same deck, same 52 cards, same hand ranks.
The other half of any published RTP is the assumption that you play optimally. A solved hold/discard chart exists for every paytable, and the quoted figure assumes you follow it on every hand. Play by instinct and your actual return lands below the stated number. The deck does not change; your decisions do.
The five-card draw and your one real decision
Draw poker games of this kind deal from a freshly shuffled single 52-card deck each hand. There is no reel weighting, no symbol frequency table, no memory of what came before. Every deal is independent of the last, so a deck is never due, warm or cold, and a run of dead hands tells you nothing about the next one.
Your decision is which cards to keep. That is genuinely the only lever you have, and it is a real one — the correct hold is calculated from the paytable, because a schedule that pays heavily for a flush makes four-to-a-flush worth keeping where a schedule that pays poorly for it does not. This is why strategy charts are paytable-specific rather than generic advice.
What is not a lever: bet sizing patterns. Raising your stake after losses, lowering it after wins, or cycling through a sequence changes the size of the numbers moving through the game and nothing about the percentage the game keeps. Expected value per unit staked is fixed by the paytable and your accuracy. Multi-hand formats, where held cards play out across several independent decks at once, follow the same logic — they raise variance and hands per hour, not return per hand.
How In Between Poker compares to other video poker
The video poker average across this site’s listings is 97.5%. At 94.6%, this title sits 2.9 points below that average, which is a substantial gap in a category where a two-point swing is the difference between a strong and a weak paytable. OneTouch’s four listed games average 94.54%, so this one is typical of the studio rather than an outlier within it.
Within the same provider the spread is wide. Russian Poker is listed at 98.42%, nearly four points higher, which makes it the more efficient OneTouch option if you want to stay with the studio. At the other end, Hold em Poker sits at 92.58%, lower still. And Super Video Poker carries no published return at all — a listing where you have to read the in-game chart to know anything about the maths.
None of these numbers predict a session. They tell you how much each game costs to play over volume. If cost per hour is what you care about, the ordering is clear and this title is not near the top of it.
Bankroll and session limits
With a 5.4% house edge and fast hand cycling, decide before you start what the session is worth to you and stop there. A useful framing: pick a figure you would happily pay for an evening’s entertainment, treat it as spent the moment you sit down, and walk away when it is gone or when you stop enjoying it.
This game is for players 18 and over. Set your budget in advance, keep it to money you can lose without consequence, and treat it as entertainment you pay for rather than income you earn. If chasing losses starts to feel like a plan, that is the signal to close the game.
One more caution on the demo. Free play uses the same rules and the same shuffled deck, so it teaches the ruleset accurately, but a good or bad run in demo mode says nothing about what real money will do. It is practice, not a forecast.
Verdict
Free to try, and the demo is genuinely the right place to start — it is where you read the pay chart the listing omits. For real money, 94.6% against a 97.5% category average is a hard number to argue with, and the unnamed variant means you cannot verify what you are being paid until the game is open in front of you. Play it to learn it; look elsewhere in the category if you are optimising cost per hand.
Frequently Asked Questions
Can I play In Between Poker for free?
Yes, a free demo is available with no download and no deposit. It runs the same rules and the same 52-card deck as the paid version, which makes it the practical way to read the in-game pay chart and learn how hands resolve. Demo results, good or bad, do not forecast real-money outcomes.
What is the RTP of In Between Poker?
OneTouch states 94.6%. That is a long-run average assuming optimal play, meaning the house keeps about 5.4% of everything staked over a very large number of hands. In this category the figure is produced by the payout schedule plus correct hold decisions, and this listing does not publish the paytable behind it.
Which video poker variant is In Between Poker?
The title does not identify a standard variant. Names like Jacks or Better or Deuces Wild signal a known ruleset with a publicly solved hold/discard chart; this one does not, so the paying hand ranks and any wild cards are unknown from the listing. Read the in-game pay chart before playing for money.
Why does the paytable matter so much in this kind of game?
Because it is the mechanism that sets the return. In Jacks or Better, shifting the full house from 9-for-1 to 8-for-1 and the flush from 6-for-1 to 5-for-1 drops the game from roughly 99.5% to about 97.3%. Two numbers, two points of return, same deck.
How does In Between Poker compare to Russian Poker?
Russian Poker, also from OneTouch, is listed at 98.42% against 94.6% here — nearly four points better, which is a meaningful difference in cost per hand over volume. Both are card games from the same studio, so if return is your deciding factor, Russian Poker is the stronger of the two listings.